SEO: MEJORA TU POSICIONAMIENTO CON INFOGRAFÍAS
Las infografías son un tipo de contenido que siempre deben incluirse en una estrategia de marketing de contenidos. Al ser visualmente atractivas y contar con la información explicada de manera precisa y detallada, son uno de los medios favoritos de los usuarios para informarse o conocer acerca de un determinado tema.
La elaboración de una infografía no es tan complicada como suele comentarse. Trabajando en equipo y con las herramientas necesarias, podrás desarrollar un excelente contenido y con un valor agregado, que la diferencie del resto.
Atrévete a realizar infografías, en este artículo encontrarás la información necesaria con los pasos y herramientas que te ayudarán a hacerlas de manera bastante profesional.


¿QUÉ SON LAS INFOGRAFÍAS Y POR QUÉ SU IMPORTANCIA?
Las infografías son un tipo de contenido relevante a la hora de realizar una estrategia de marketing de contenidos y SEO. Estas te ayudarán cuando trabajes con el objetivo de obtener enlaces de calidad, que a su vez son un factor vital a la hora de posicionar un sitio web.
Son enlaces de calidad cuando se cumplen estos requisitos:
- Vienen de una fuente relevante y confiable.
- Las palabras del enlace son sinónimos, parte de una frase o son de la marca.
- No son recíprocos.
- No son de pago.
En la actualidad, grandes marcas hacen uso de las infografías para compartir su contenido y con ello conseguir enlaces de calidad. A continuación, algunos ejemplos:
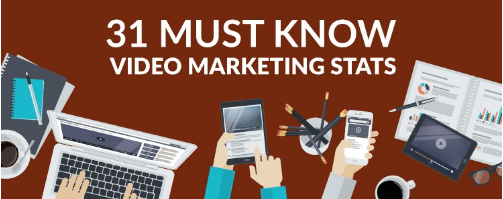
Hubspot
URL: https://blog.hubspot.com/marketing/video-marketing-statistics
Referring Domains: 1,263
Backlinks: 53,788
BBC
URL: https://www.bbc.com/future/story/20131218-absolute-zero-to-absolute-hot
Referring Domains: 135
Backlinks: 2,727


PASOS PARA CREAR UNA INFOGRAFÍA
Estos son los pasos para elaborar una buena infografía y llegar al objetivo de adquirir enlaces de calidad.
2.1. Definición del tema de infografía
Lo primero que debes hacer es seleccionar el tema de la infografía. En el artículo de Marketing de Contenidos puedes encontrar varios tips de cómo identificar el Core del mensaje.
Es importante mencionar que los temas a seleccionar deben ser de preferencia “temas de tendencia”, “temas perennes” y/o “temas controversiales”.
Algunas herramientas para este fin son:
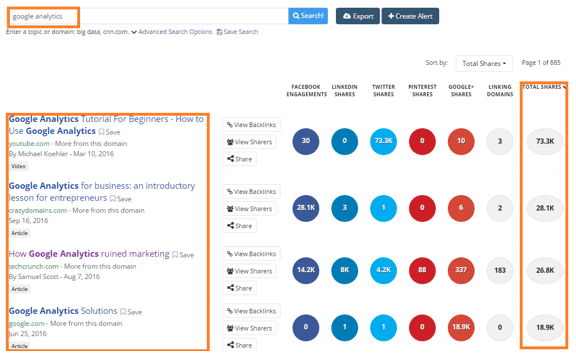
BuzzSumo: sigue siendo una herramienta ideal para poder identificar los posibles temas a plasmar en la infografía.
Puedes buscar temas relacionados a una keyword específica y la herramienta te mostrará un listado de diferentes temas. Con ello puedes darte una idea de cuáles son los temas que consiguen mayor popularidad en las redes sociales.
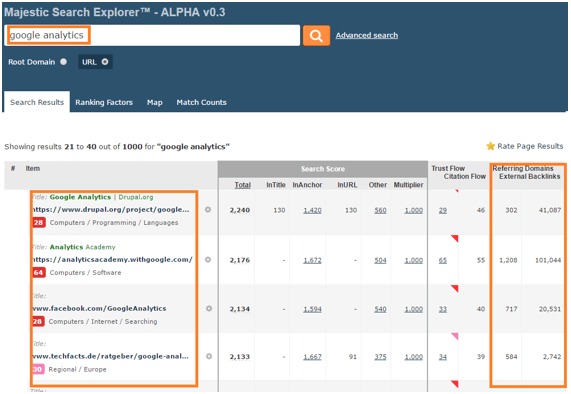
Majestic: con esta herramienta podrás realizar la búsqueda de una keyword específica y lo interesante es que visualizarás el número de backlinks conseguidos, así como la cifra de Referrers Domains.
Con esta información es mucho más probable obtener el éxito en una infografía, siempre y cuando si identificas un tema que haya obtenido buenos resultados anteriormente.
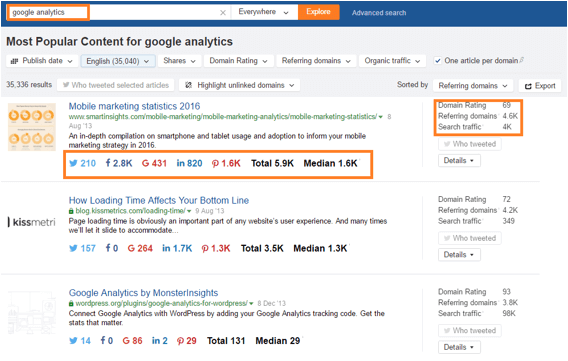
Ahrefs: con esta herramienta también puedes realizar la búsqueda de una keyword específica y lo bueno es que sabrás su popularidad en redes sociales, como el número de backlinks y Referrers Domains que consiguió el contenido.
2.2. Investigación de sitios web "target" que publiquen nuestra infografía
La idea es contar con un listado de sitios web (medios, blogs, etc.) que estén relacionados con el tema seleccionado.
Un método para identificar estos medios o blogs es mediante la búsqueda en Google del tema seleccionado:

También debes investigar influyentes que tengan relación con tu tema, esto lo puedes hacer con Followerwonk:
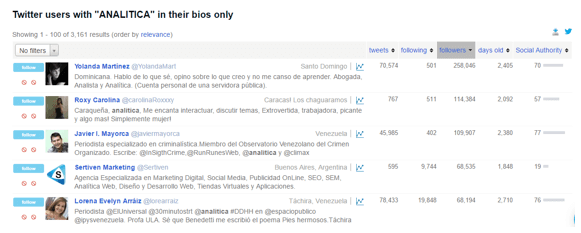
Una vez que tienes el listado de los sitios web que te interesan, es momento de investigar el contacto de cada web, para ello una herramienta valiosa es BuzzStream.
Esta herramienta tiene la capacidad de obtener los datos de contacto del sitio web, como correo electrónico, páginas de formularios y redes sociales.
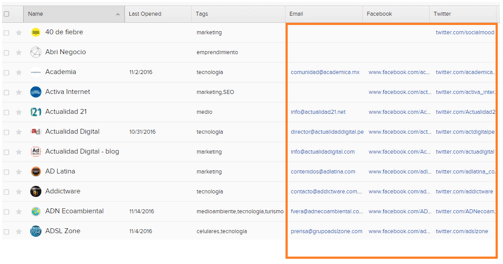
Asimismo, cuando ya identificado el tema y tienes el listado de contactos para la infografía es momento de pasar al desarrollo del contenido.
2.3. Desarrollo de contenido para la infografía
A la hora de empezar con el desarrollo del contenido que tendrá la infografía, es importante considerar los siguientes puntos:
- Crea un documento y recopila todos los datos e información que necesitas para tu infografía.
- Encuentra información que pueda ser organizada y representada visualmente.
- Para los temas de colores, considera el tema y el mercado objetivo.
- Investiga otras infografías existentes, y asegúrate de que la tuya sea 10 veces mejor.
- Piensa en tu audiencia y cómo tu infografía les ayudará a resolver un problema.
- Céntrate en estadísticas confiables.
- Asegúrate de citar fuentes cuando sea necesario.
- Concéntrate en que tu contenido puede desencadenar una respuesta emocional.

2.4. Diseño de la infografía
Después de terminar de documentar el contenido de la infografía, es el momento de plasmar los datos en un diseño lógico y agradable.
Recuerda que una buena combinación de datos informativos y diseño, pueden marcar la diferencia entre una infografía regular y una que puede ser viral y obtener backlinks.
Considera los siguientes puntos para el diseño:
- Buen diseño. Tu infografía debe contar con un diseño llamativo y destacable.
- Coloca el mejor contenido en la parte superior.
- Muestra datos estadísticos, estos funcionan muy bien.
- Que tu diseño no sea abrumador.
- Haz una infografía que sea vertical.
- Utiliza fuentes grandes, varios diseñadores tratan de insertar mucha información en un gráfico reduciendo el tamaño de la letra.
2.5. Optimiza la página de tu infografía
Antes de pasar a la publicación de tu página que contiene la infografía es recomendable optimizarla. Para ello ten en cuenta estos puntos:
- URL de la infografía: considera una URL amigable y de preferencia que sea fácil de recordar.
- Title: la página debe tener el título de tu infografía.
- Contenido: para complementar la información en la página, es recomendable generar contenido que acompañe los datos de la infografía y de preferencia que tenga más de mil palabras.
- Velocidad de Página: verifica que el peso de tu página no sea alto, por ello, primero debes saber cuál es el peso de la imagen de tu infografía.
- Botones Sociales: agrega los botones de las distintas redes sociales, para que los usuarios tengan la opción de compartir la infografía.
2.6. Publica tu infografía y ayúdala a tener éxito
Subir y publicar tu infografía no es suficiente para ganar backlinks y acciones en las redes sociales.
Por ello, es recomendable que insertes código embed debajo de tu infografía, con ello las personas que estén interesadas en publicarla podrán hacerlo de manera casi automática.

Tus infografías tienen que ser fáciles de compartir en las redes sociales. La aplicación Image Sharer de SumoMe es muy buena para ello, ya que cuando sostienes el mouse sobre la infografía, se mostrarán íconos para compartir en las redes, como en la captura de pantalla.

No olvides agregar el contenido que has generado de mil palabras, porque esto ayudará a Google a rastrear el contenido. Es mejor tener la infografía en la parte superior del artículo, y la parte contextual en la parte inferior.
2.7. Difusión de la infografía
En este paso, algunas de las maneras de promover tu infografía son las siguientes:
- Compartiéndola en tus cuentas de redes sociales.
- Enviando un newsletter a tus contactos.
- Es hora de revisar tu lista de influyentes y contactarlos para que puedan ayudarte a que tu infografía sea viral. Pídeles comentarios sobre tu último trabajo, pero no les digas directamente que compartan tu infografía. Si les gusta, aumentan tus posibilidades de ganar backlinks.
- Mira tus contactos de blogs y envíales un correo electrónico. El objetivo es conseguir que los bloggers escriban acerca de tu infografía y así obtengas más exposición. El mensaje debe estar optimizado y personalizado, por ejemplo:
“Buen día [Nombre],
Estaba buscando información sobre analítica para mi blog y me encontré con tu sitio web [nombre de la web]. He visto que tienes bastante contenido útil sobre métricas y me gustó. Ahora mismo acabo de terminar de crear una infografía sobre métricas en mi blog, por la similitud de nuestras temáticas quizás quieras echarle un vistazo. Házmelo saber y te la ¡envío!
Saludos, Lesley”.
Este mensaje es corto y se lee rápido, además es personalizado porque incluye su nombre y su web, y no es invasivo. Simplemente le sugieres enseñarle la infografía, pero al final no lo haces. De esa manera lograrás obtener enlaces contextuales, que son los que tienen valor.

2.8. Ofrece contenido adicional
Recuerda que la idea es ofrecer valor y puedes hacerlo de la siguiente manera:
- Mostrando una infografía interesante sobre un tema que les llame la atención.
- Dándoles la opción de compartir ese contenido con su público, que también está interesado en ese tema.
- Ofreciendo contenido gratuito para complementar la infografía. Puedes enviarles una introducción de 250-300 palabras para su sitio.
2.9. Mide el éxito de tu infografía
Los objetivos finales de una infografía son conseguir más visitantes a tu sitio web y ganar enlaces de calidad que pueden ayudarle en el posicionamiento.
Cuando tu infografía se publique en otros sitios, comprueba en Google Analytics y ve qué sitios te dan la mayor cantidad de tráfico. Revisa Majestic, Ahrefs para visualizar quienes te enlazaron.
CONCLUSIONES
Finalmente, aprendiste los pasos que se tienen en cuenta al realizar una infografía. Asimismo, conociste las herramientas que te ayudarán a buscar información, crear contenido original y de valor.
Ahora, que ya sabes anímate a hacerlas. Aportarán mucho a tu estrategia de marketing de contenidos y al mismo tiempo ofrecerás buena información a tus clientes sobre tu sitio web. Esperamos que te haya servido este artículo y si tienes algunas dudas, escríbenos.
¿ESTÁS PENSANDO EN GANAR NOTORIEDAD PARA TU EMPRESA EN EL MUNDO DIGITAL? EN ATTACH TE AYUDAMOS CON TU PROYECTO!
TEMAS: SEO, Marketing de Contenidos


